Getting it Right: Solving GHSA challenges with math, Part VIII

Welcome back. This is the eighth part in a series on answering the question "Which teams are deserving of a playoff invitation?" In it I'll outline a model I'll refer to as "Extended Standings" and over the course of the series I'll provide the exact details so anyone interested can independently verify the results.
Index: Part I | Part II | Part III | Part IV | Part V | Part VI | Part VII
In Part VII of the series, I closed out the complete explanation of the Extended Standings, to include providing the spreadsheet I personally use to calculate them.
For those not aware, I updated the spreadsheet as explained in the post for the Week 4 standings, most notably by separating Class A into "Class A - Public" and "Class A – Private" and by making some provisions to capture out of state games. Here's an updated version of the 2014 spreadsheet that we can work off of for this post: 2014 Extended Standings.
So now that we have a complete ranking for all 417 GHSA teams, let’s quickly compare the teams the Extended Standings would have selected in 2014 against the teams selected by the traditional region standings and the Class A power ratings.
Of the 192 teams selected across all classifications, 164 (85.4%) are the same. Of the 28 teams that would have benefited from the use of the Extended Standings, most come from the stronger regions. For example, the Extended Standings would have included all six Region 1-AAAAAA teams in 2014 after their historic 29-0 cumulative performance against outside competition.
In fact, the 28 teams the Extended Standings preferred were a combined 82-92-0 (47.1%) against region opponents but 60-42-1 (58.7%) against outside competition. For comparison, the 28 teams the Extended Standings would have excluded went 95-74-0 (56.2%) against region opponents but only 48-61-0 (44.0%) against outside competition. These numbers clearly demonstrate the Extended Standings look past simply adding up the number of region wins and dividing by the total number of region games in answering our central question of “Which teams are deserving of a playoff invitation?”
At any rate, now let's consider the question of how to most effectively seed these teams for a playoff by examining the Class A Public school bracket.
Here's how the Extended Standings would have seeded the 2014 season:
| Ov Rnk | Cl Rnk | Team | W | L | T | adjW% | Rating | xWins | xLosses | xWin% |
|---|---|---|---|---|---|---|---|---|---|---|
| 74 | 1 | Marion County | 10 | 0 | 0 | 0.930 | 6.65 | 312.69 | 103.31 | 75.2% |
| 96 | 2 | Hawkinsville | 9 | 1 | 0 | 0.881 | 6.39 | 298.42 | 117.58 | 71.7% |
| 111 | 3 | Irwin County | 8 | 1 | 1 | 0.830 | 6.07 | 280.45 | 135.55 | 67.4% |
| 149 | 4 | Charlton County | 9 | 1 | 0 | 0.857 | 5.70 | 258.15 | 157.85 | 62.1% |
| 186 | 5 | Dooly County | 7 | 3 | 0 | 0.694 | 5.18 | 225.51 | 190.49 | 54.2% |
| 192 | 6 | Emanuel County Institute | 8 | 2 | 0 | 0.789 | 5.07 | 218.83 | 197.17 | 52.6% |
| 205 | 7 | Mount Zion (Carroll) | 7 | 3 | 0 | 0.689 | 4.91 | 208.15 | 207.85 | 50.0% |
| 212 | 8 | Clinch County | 6 | 4 | 0 | 0.623 | 4.87 | 205.71 | 210.29 | 49.5% |
| 216 | 9 | Commerce | 8 | 2 | 0 | 0.750 | 4.80 | 201.57 | 214.43 | 48.5% |
| 233 | 10 | Claxton | 7 | 3 | 0 | 0.627 | 4.63 | 190.50 | 225.50 | 45.8% |
| 249 | 11 | Lincoln County | 7 | 3 | 0 | 0.675 | 4.42 | 177.21 | 238.79 | 42.6% |
| 254 | 12 | Greenville | 5 | 5 | 0 | 0.496 | 4.37 | 173.71 | 242.29 | 41.8% |
| 257 | 13 | Atkinson County | 6 | 4 | 0 | 0.600 | 4.30 | 169.39 | 246.61 | 40.7% |
| 258 | 14 | Schley County | 6 | 4 | 0 | 0.560 | 4.30 | 169.28 | 246.72 | 40.7% |
| 285 | 15 | Johnson County | 5 | 5 | 0 | 0.573 | 4.00 | 150.80 | 265.20 | 36.3% |
| 291 | 16 | Telfair County | 6 | 4 | 0 | 0.548 | 3.93 | 146.38 | 269.62 | 35.2% |
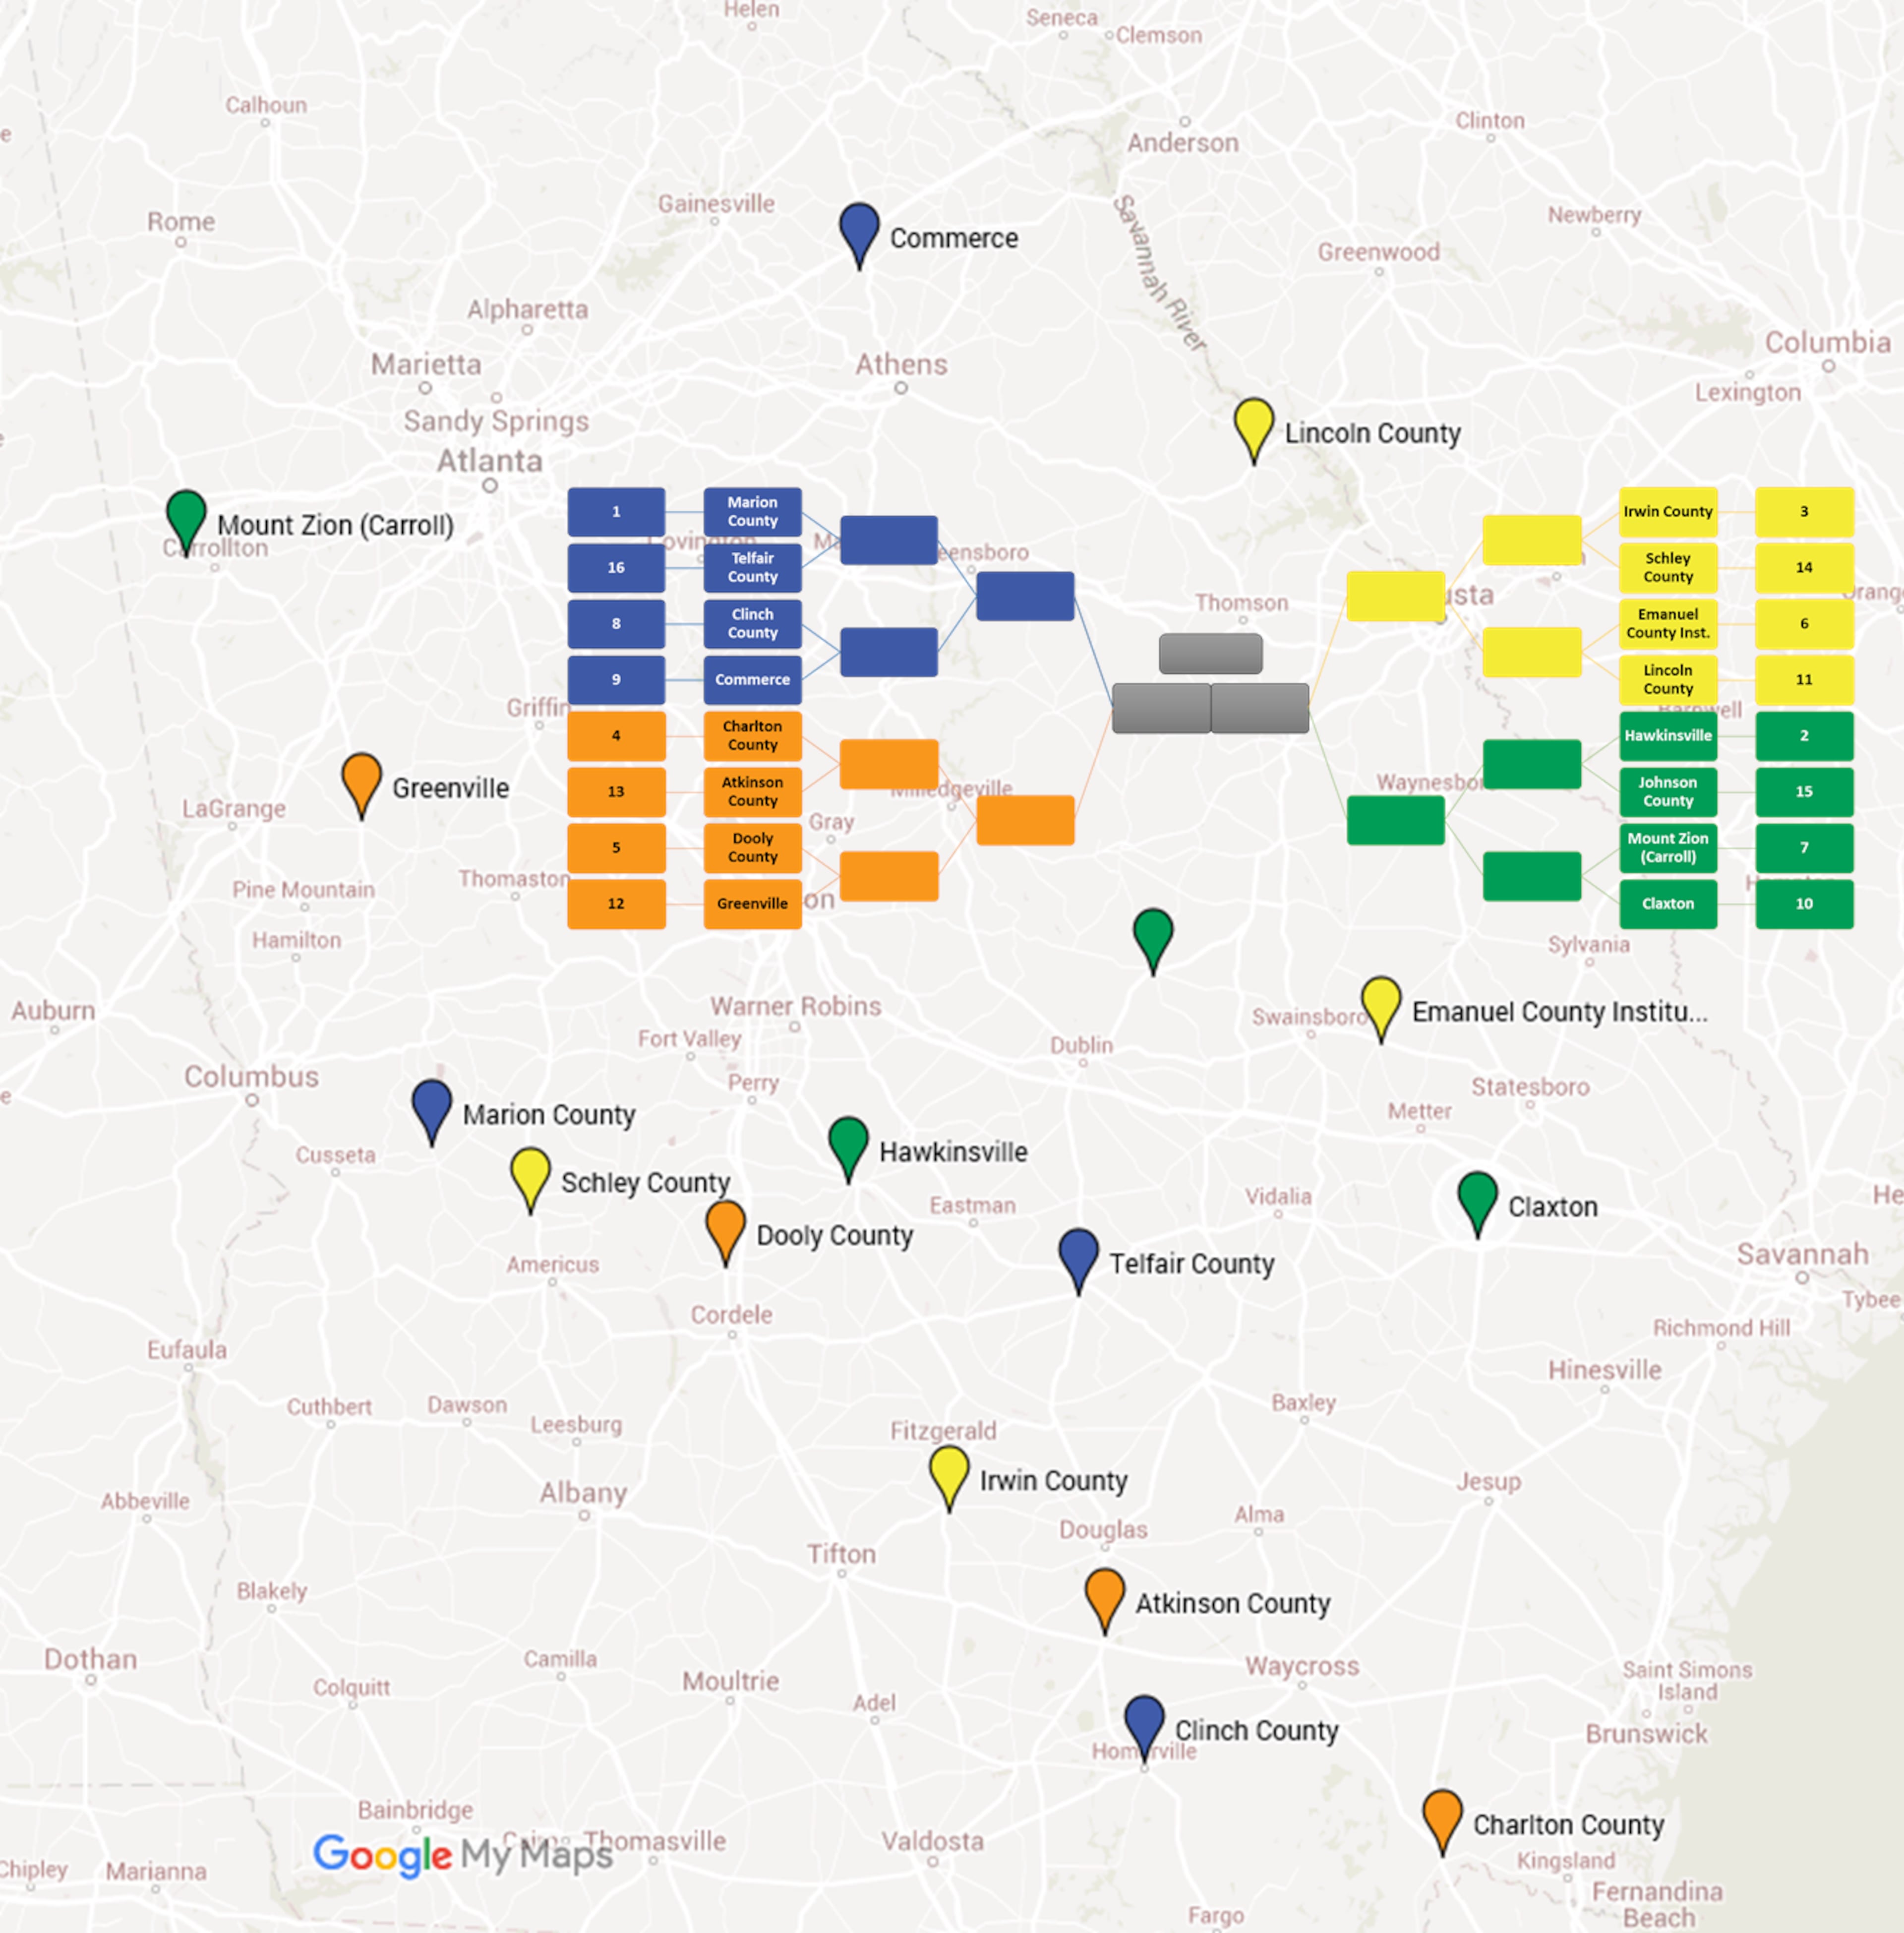
First let's construct the 2014 brackets using the traditional pairings of #1 versus #16, #2 versus #15, etc., and overlay it over how the teams are spread across the state:

Now, let's measure the total "expected" travel distance between the teams through the semifinals.
By "expected", I mean we'll assume the better seeded team wins in each instance. For example, we'll assume Marion County, the #1 seed, will defeat Telfair County, the #16 seed, while Clinch County, the #8 seed, will defeat Commerce, the #9 seed. This "expected" assumption allows us to assume a Marion County versus Clinch County pairing in the second round. So the three travel distances we're concerned with in this example are Telfair County to Marion County, Commerce to Clinch County, and Clinch County to Marion County.
For travel distance we'll use what is referred to as Great-Circle Distance, or GCD, which is perhaps more commonly thought of "as the crow flies". In short, this is the measurement of the most direct distance between two points over the surface of the earth. We'll count this distance twice for each game to account for a round trip.
Below is our total expected GCD for the entire Class A- Public bracket through the semifinals:
| First Round | ||||
|---|---|---|---|---|
| Seed | Host | Seed | Visitor | GCD |
| 1 | Marion County | 16 | Telfair County | 194.92 |
| 2 | Hawkinsville | 15 | Johnson County | 108.00 |
| 3 | Irwin County | 14 | Schley County | 151.19 |
| 4 | Charlton County | 13 | Atkinson County | 119.83 |
| 5 | Dooly County | 12 | Greenville | 168.04 |
| 6 | Emanuel County Institute | 11 | Lincoln County | 171.45 |
| 7 | Mount Zion (Carroll) | 10 | Claxton | 424.56 |
| 8 | Clinch County | 9 | Commerce | 443.23 |
| Quarterfinals | ||||
| Seed | Host | Seed | Visitor | GCD |
| 1 | Marion County | 8 | Clinch County | 277.64 |
| 2 | Hawkinsville | 7 | Mount Zion (Carroll) | 265.21 |
| 3 | Irwin County | 6 | Emanuel County Institute | 187.52 |
| 4 | Charlton County | 5 | Dooly County | 274.14 |
| Semifinals | ||||
| Seed | Host | Seed | Visitor | GCD |
| 1 | Marion County | 4 | Irwin County | 364.63 |
| 2 | Hawkinsville | 3 | Irwin County | 100.94 |
| Total Expected GCD | 3,251.29 |
The 3,251.29 GCD miles equates to an average of 232.24 GCD miles per game.
We can use a broad assumption to estimate the driving distance by saying 1 GCD mile equals 1.6 driving miles, so 232.24 x 1.6 = 371.58 driving miles round trip. Also, we can assume an average speed of 45 miles per hour, so on average each game takes 371.58 / 45 mph = about 8 hours and 15 minutes total driving time.
Another option is to use Google to find the exact driving distance and travel times for each game. The advantage would be that Google can consider the difference between interstates and rural roads, but the numbers above are sufficient for our purposes here.
So let's imagine we found this travel time excessive and wanted to reduce it in some practical way.
We can start by revisiting our brackets and for now simply dividing them into color coded quadrants and color code our teams on the map:
Now let's replace the #1 through #16 seeds for the overall bracket with #1 through #4 seeds in each quadrant:

Finally, let's imagine all equal seeds are interchangeable so that any two same seeds could be swapped with each other in an effort to reduce the expected GCD. Here we're looking to move the teams around the quadrants in an effort to find what I'll refer to as the Minimum Expected GCD, or the MEGCD. The only constraint is that each quadrant must have a #1, #2, #3, and #4 seed.
Since we are using the expected GCD, we can tackle this problem in small steps. Let's start by looking through all the #1 versus #4 possibilities to find the one with the lowest GCD.
Below is a matrix showing the GCD between each of our #1 seeded teams and each of our #4 seeded teams with their original seed in parenthesis:
| 4 (13) | 4 (14) | 4 (15) | 4 (16) | ||
| Atkinson County | Schley County | Johnson County | Telfair County | ||
| 1 (1) | Marion County | 244.94 | 35.16 | 216.43 | 194.92 |
| 1 (2) | Hawkinsville | 152.59 | 93.75 | 108.00 | 75.08 |
| 1 (3) | Irwin County | 58.62 | 151.19 | 168.90 | 75.08 |
| 1 (4) | Charlton County | 119.83 | 329.47 | 273.51 | 197.78 |
Now let's enumerate through each of the 24 possible combinations to find the one with the lowest combined GCD:
| Matchup 1 | Matchup 2 | Matchup 3 | Matchup 4 | Calculation | GCD |
|---|---|---|---|---|---|
| Marion County- Atkinson County |
Hawkinsville- Schley County |
Irwin County- Johnson County |
Charlton County- Telfair County |
244.94 + 93.75 + 168.90 + 197.78 = |
705.37 |
| Marion County- Atkinson County |
Hawkinsville- Schley County |
Irwin County- Telfair County |
Charlton County- Johnson County |
244.94 + 93.75 + 74.99 + 273.51 = |
687.19 |
| Marion County- Atkinson County |
Hawkinsville- Johnson County |
Irwin County- Schley County |
Charlton County- Telfair County |
244.94 + 108.00 + 151.19 + 197.78 = |
701.90 |
| Marion County- Atkinson County |
Hawkinsville- Johnson County |
Irwin County- Telfair County |
Charlton County- Schley County |
244.94 + 108.00 + 74.99 + 329.47 = |
757.39 |
| Marion County- Atkinson County |
Hawkinsville- Telfair County |
Irwin County- Schley County |
Charlton County- Johnson County |
244.94 + 75.08 + 151.19 + 273.51 = |
744.72 |
| Marion County- Atkinson County |
Hawkinsville- Telfair County |
Irwin County- Johnson County |
Charlton County- Schley County |
244.94 + 75.08 + 168.90 + 329.47 = |
818.39 |
| Marion County- Schley County |
Hawkinsville- Atkinson County |
Irwin County- Johnson County |
Charlton County- Telfair County |
35.16 + 152.59 + 168.90 + 197.78 = |
554.43 |
| Marion County- Schley County |
Hawkinsville- Atkinson County |
Irwin County- Telfair County |
Charlton County- Johnson County |
35.16 + 152.59 + 74.99 + 273.51 = |
536.25 |
| Marion County- Schley County |
Hawkinsville- Johnson County |
Irwin County- Atkinson County |
Charlton County- Telfair County |
35.16 + 108.00 + 58.62 + 197.78 = |
399.56 |
| Marion County- Schley County |
Hawkinsville- Johnson County |
Irwin County- Telfair County |
Charlton County- Atkinson County |
35.16 + 108.00 + 74.99 + 119.83 = |
337.98 |
| Marion County- Schley County |
Hawkinsville- Telfair County |
Irwin County- Atkinson County |
Charlton County- Johnson County |
35.16 + 75.08 + 58.62 + 273.51 = |
442.37 |
| Marion County- Schley County |
Hawkinsville- Telfair County |
Irwin County- Johnson County |
Charlton County- Atkinson County |
35.16 + 75.08 + 168.90 + 119.83 = |
398.97 |
| Marion County- Johnson County |
Hawkinsville- Atkinson County |
Irwin County- Schley County |
Charlton County- Telfair County |
216.43 + 152.59 + 151.19 + 197.78 = |
717.98 |
| Marion County- Johnson County |
Hawkinsville- Atkinson County |
Irwin County- Telfair County |
Charlton County- Schley County |
216.43 + 152.59 + 74.99 + 329.47 = |
773.47 |
| Marion County- Johnson County |
Hawkinsville- Schley County |
Irwin County- Atkinson County |
Charlton County- Telfair County |
216.43 + 93.75 + 58.62 + 197.78 = |
566.58 |
| Marion County- Johnson County |
Hawkinsville- Schley County |
Irwin County- Telfair County |
Charlton County- Atkinson County |
216.43 + 93.75 + 74.99 + 119.83 = |
505.00 |
| Marion County- Johnson County |
Hawkinsville- Telfair County |
Irwin County- Atkinson County |
Charlton County- Schley County |
216.43 + 75.08 + 58.62 + 329.47 = |
679.60 |
| Marion County- Johnson County |
Hawkinsville- Telfair County |
Irwin County- Schley County |
Charlton County- Atkinson County |
216.43 + 75.08 + 151.19 + 119.83 = |
562.53 |
| Marion County- Telfair County |
Hawkinsville- Atkinson County |
Irwin County- Schley County |
Charlton County- Johnson County |
194.92 + 152.59 + 151.19 + 273.51 = |
772.20 |
| Marion County- Telfair County |
Hawkinsville- Atkinson County |
Irwin County- Johnson County |
Charlton County- Schley County |
194.92 + 152.59 + 168.90 + 329.47 = |
845.87 |
| Marion County- Telfair County |
Hawkinsville- Schley County |
Irwin County- Atkinson County |
Charlton County- Johnson County |
194.92 + 93.75 + 58.62 + 273.51 = |
620.80 |
| Marion County- Telfair County |
Hawkinsville- Schley County |
Irwin County- Johnson County |
Charlton County- Atkinson County |
194.92 + 93.75 + 168.90 + 119.83 = |
577.40 |
| Marion County- Telfair County |
Hawkinsville- Johnson County |
Irwin County- Atkinson County |
Charlton County- Schley County |
194.92 + 108.00 + 58.62 + 329.47 = |
691.00 |
| Marion County- Telfair County |
Hawkinsville- Johnson County |
Irwin County- Schley County |
Charlton County- Atkinson County |
194.92 + 108.00 + 151.19 + 119.83 = |
573.93 |
A quick search through the table finds our lowest GCD miles for the #1 versus #4 seeds is 337.98. Compare that to our total of 573.93 GCD miles for our original #1 versus #4 seeding and we've already cut about 236 miles out of just four games, an average of 59 GCD miles per game. Using our assumptions from above, we've reduced the trip for each game by 94 driving miles and over 2 hours of driving time for these first round games.
We repeat this process to find the lowest GCD miles for #2 and #3 seeds, and to complete the quadrants we do this again for the #1 versus #2 seeds since we're focusing on the expected GCD. For the larger classifications we do this for the 1-8, 2-7, 3-6, 4-5, 1-4, 2-3, and 1-2 pairings.
Below is the final Class A - Public bracket:

A quick comparison with the previous map makes it apparent the quadrants are more closely grouped together. For example, #1 seed Charlton County and #4 seed Atkinson County are still grouped together but are paired with the much closer #2 and #3 seeds of Clinch County and Claxton, each of which were pulled from totally different brackets.
Let's revisit the expected GCD to see the actual difference:
| First Round | ||||
|---|---|---|---|---|
| Seed | Host | Seed | Visitor | GCD |
| 1 | Marion County | 4 | Schley County | 35.16 |
| 2 | Mount Zion (Carroll) | 3 | Commerce | 210.02 |
| 1 | Hawkinsville | 4 | Johnson County | 108.00 |
| 2 | Dooly County | 3 | Greenville | 168.04 |
| 1 | Charlton County | 4 | Atkinson County | 119.83 |
| 2 | Clinch County | 3 | Claxton | 182.76 |
| 1 | Irwin County | 4 | Telfair County | 74.99 |
| 2 | Emanuel County Institute | 3 | Lincoln County | 171.45 |
| Quarterfinals | ||||
| Seed | Host | Seed | Visitor | GCD |
| 1 | Marion County | 2 | Mount Zion (Carroll) | 185.44 |
| 1 | Hawkinsville | 2 | Dooly County | 43.59 |
| 1 | Charlton County | 2 | Clinch County | 92.94 |
| 1 | Irwin County | 2 | Emanuel County Institute | 187.52 |
| Semifinals | ||||
| Seed | Host | Seed | Visitor | GCD |
| 1 | Marion County | 1 | Hawkinsville | 122.58 |
| 1 | Irwin County | 1 | Charlton County | 178.30 |
| Total Expected GCD | 1,880.61 |
Here the longest distance is Commerce traveling to Mount Zion in Carroll for a total of 210 GCD miles round trip. In our original bracket, six of the fourteen games were greater than this distance.
Using our assumptions from above, 1,880.61 miles equates to an average of 134.33 GCD miles per game. This gives us 134.33 x 1.6 = 214.93 driving miles round trip and 214.93 / 45 mph = about 4 hours and 47 minutes total driving time.
So relaxing the seeding from a 16-team bracket to four-team quadrants allows us to reduce the expected GCD an impressive 42.2% for the Class A - Public bracket.
Let's see how this approach performed across all classifications:
| Straight Seeding | MEGCD Seeding | ||||||||
|---|---|---|---|---|---|---|---|---|---|
| Class | Total GCD | Per Game | Drive Miles | Drive Time | Total GCD | Per Game | Drive Miles | Drive Time | Reduction |
| AAAAAA | 5,739.31 | 191.31 | 306.10 | 6.80 | 3,221.91 | 107.40 | 171.85 | 3.81 | 43.9% |
| AAAAA | 5,725.53 | 190.85 | 305.35 | 6.79 | 3,110.78 | 103.69 | 165.91 | 3.69 | 45.7% |
| AAAA | 5,793.57 | 193.12 | 308.99 | 6.87 | 4,425.48 | 147.52 | 236.03 | 5.25 | 23.6% |
| AAA | 6,695.49 | 223.18 | 357.09 | 7.94 | 3,661.31 | 122.04 | 195.27 | 4.34 | 45.3% |
| AA | 8,299.41 | 276.65 | 442.64 | 9.84 | 5,861.01 | 195.37 | 312.59 | 6.95 | 29.4% |
| A - Private | 3,355.30 | 239.66 | 383.46 | 8.52 | 2,726.40 | 194.74 | 311.59 | 6.92 | 18.7% |
| A - Public | 3,251.29 | 232.23 | 371.58 | 8.26 | 1,880.61 | 134.33 | 214.93 | 4.78 | 42.2% |
| Total | 38,859.89 | 218.31 | 349.30 | 7.76 | 24,887.50 | 139.82 | 223.71 | 4.97 | 36.0% |
In total, nearly 14,000 miles were reduced from our expected GCD. This translates into roughly 22,350 fewer driving miles total, or nearly three hours driving time per game, reducing travel costs for schools and probably increasing gate receipts since more fans are likely to travel as well.
I'd be interested if anyone has some good data we can use to estimate the reduced cost, such as school bus maintenance costs per mile and miles per gallon, fuel costs, driver cost per hour, buses required per game, hotel considerations, etc., or any information we can use to estimate the increased gates.
Anyway, aside from the logistics and financial impact, there's also a nice side effect of awarding four teams with a #1 seed and the brackets having much more of a local flavor.
Well, that's it for today. No formulas this time, just concepts!
Next time I'll aim for the conclusion of this series and will close by considering the broader implications of adopting the Extended Standings for use in all classifications.
As always, I look forward to your comments!


