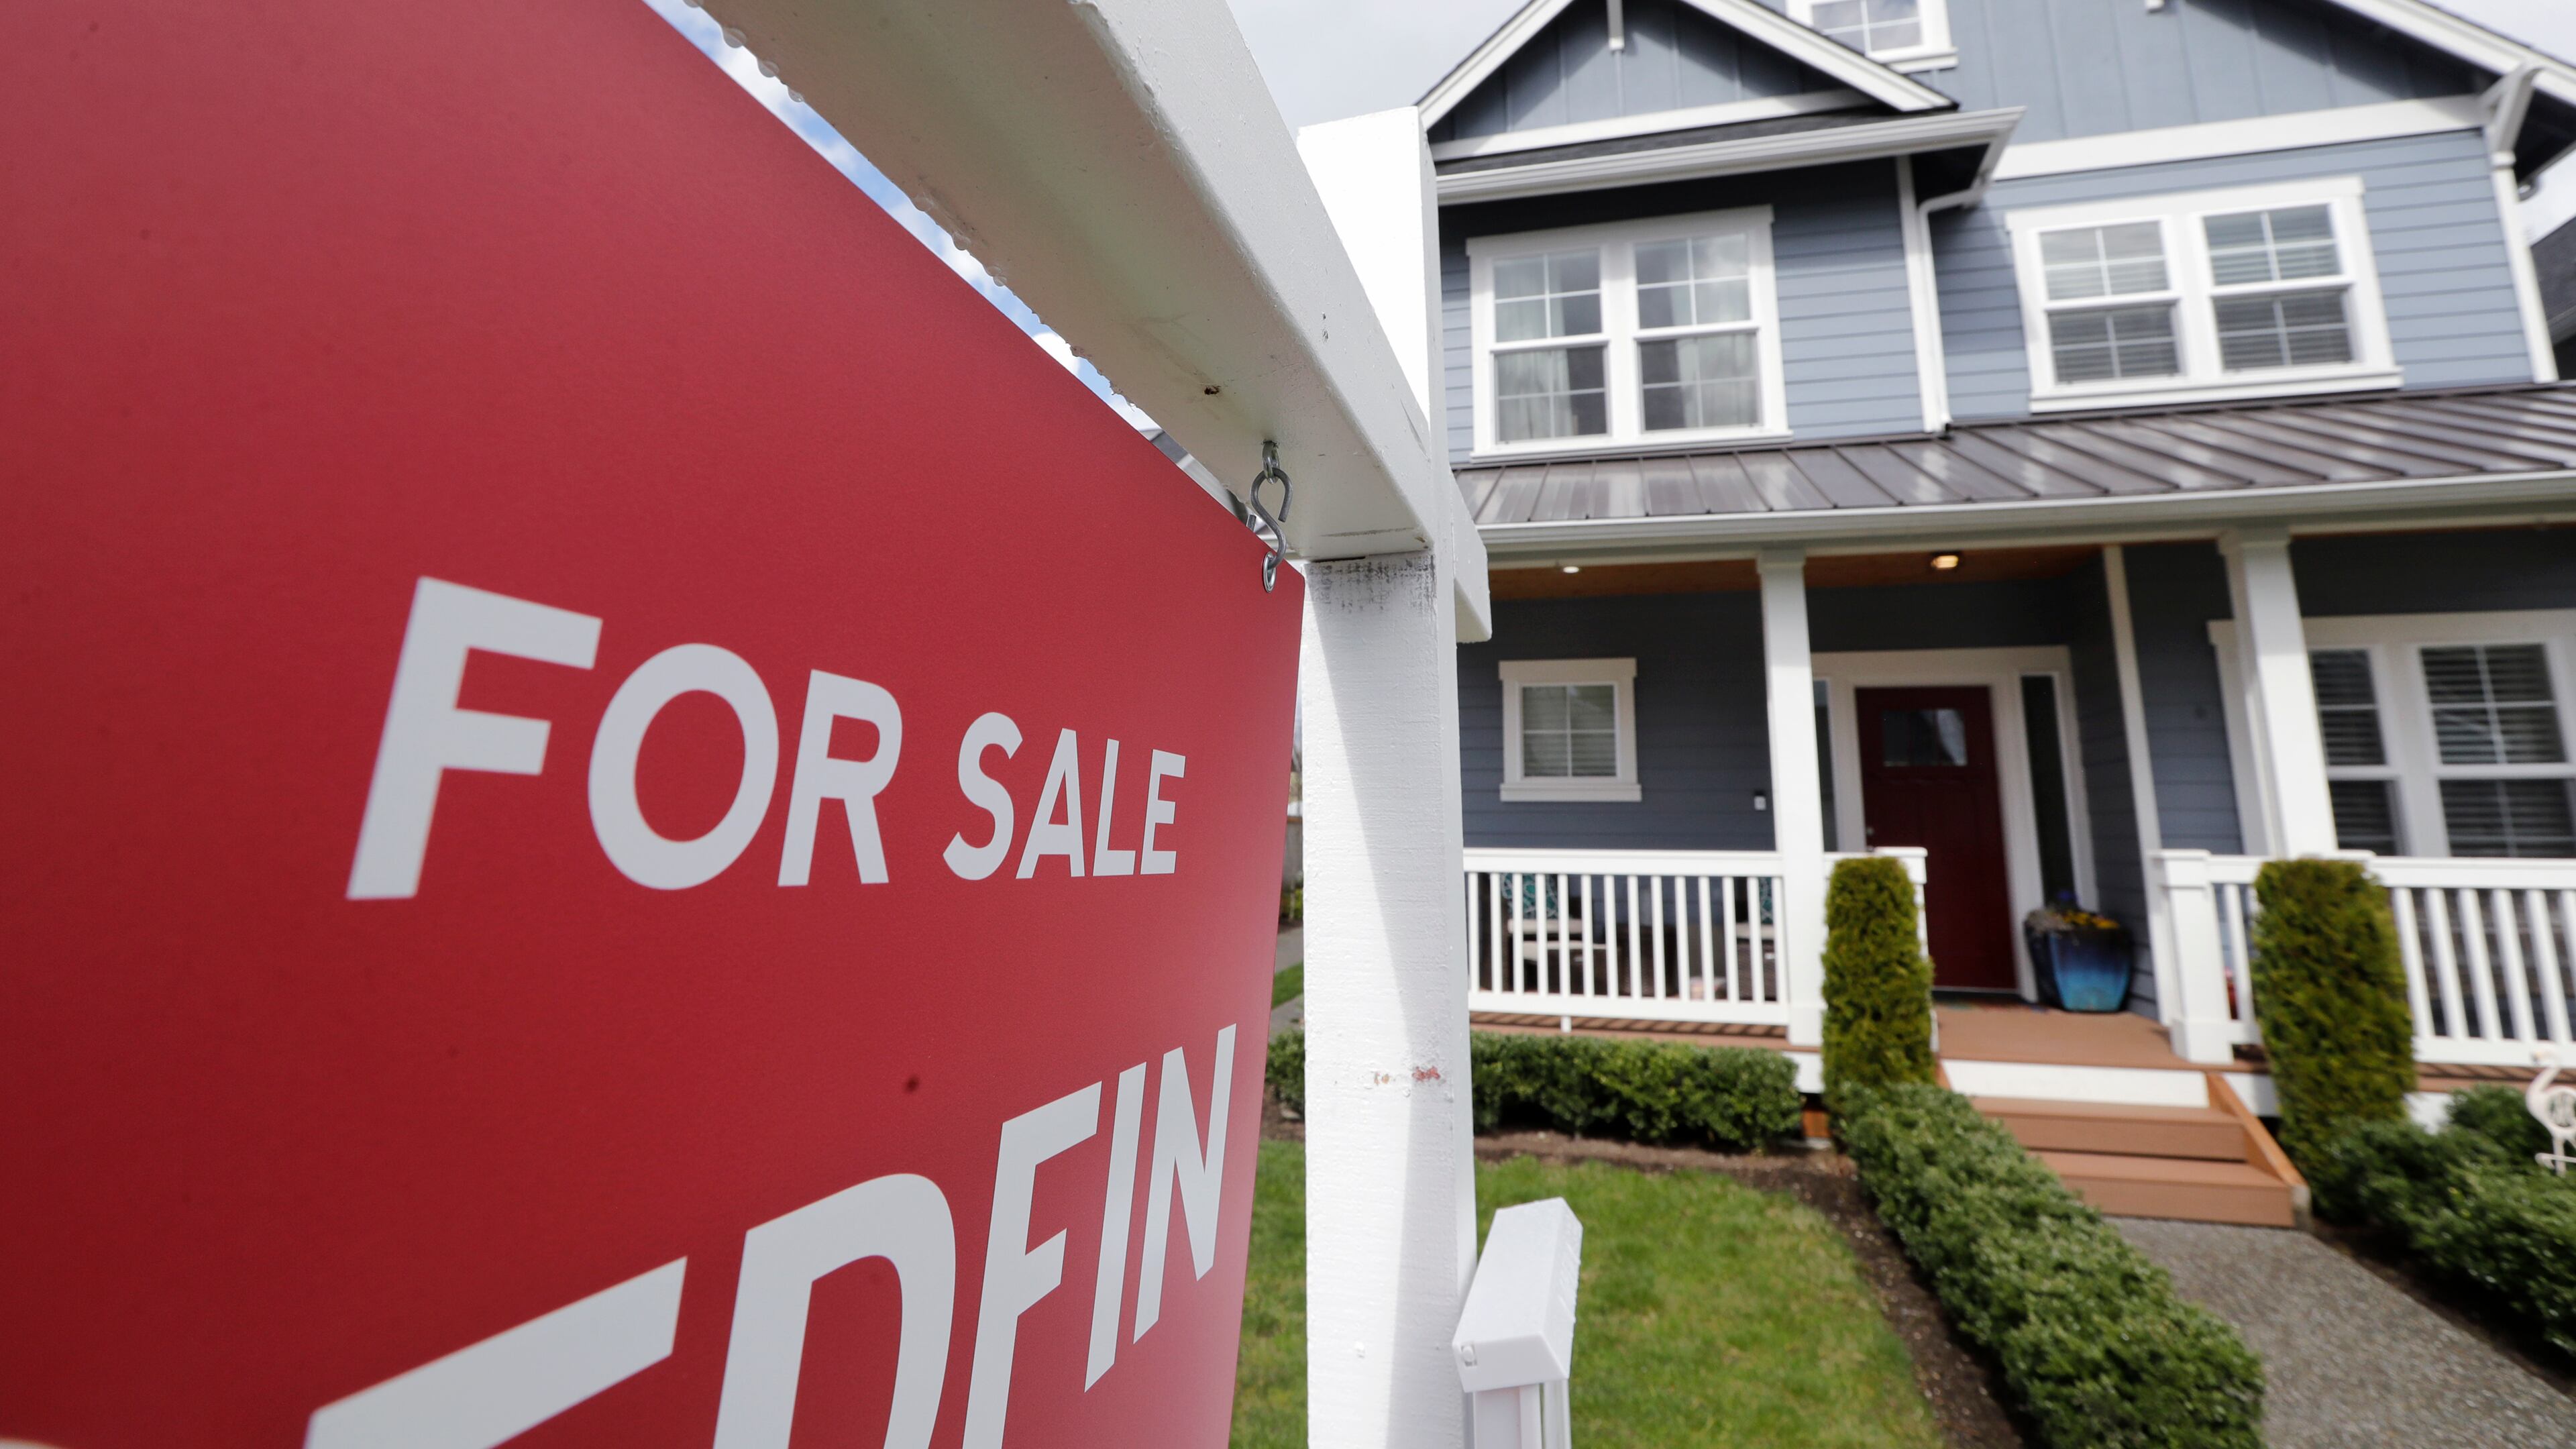
Pandemic housing market solid for metro Atlanta

Despite the pandemic and the economic upheaval it’s causing, metro Atlanta home prices have risen 6.8% over the past 12 months, according to a much-watched national report.
The region’s home prices have doubled since hitting bottom in 2012 and are 21% higher than they were at the previous market peak, in July 2007, just before the burst of the housing bubble, according to the monthly index released by S&P CoreLogic Case-Shiller.
“Since June, our monthly readings have shown accelerating growth in home prices,” said Craig Lazzara, managing director at S&P Dow Jones Indices.
Atlanta’s pace of increase came in behind the national average gain of 8.4%, according to Case-Shiller. Among major metro areas, Phoenix had the largest gain: a 12.7% jump over the year, followed by Seattle with an 11.7% increase.
Nationally, average prices have been rising at the fastest rate since 2014, Lazzara said. “Although the full history of the pandemic’s impact on housing prices is yet to be written, the data from the last several months are consistent with the view that COVID has encouraged potential buyers to move from urban apartments to suburban homes,” he said.
In metro Atlanta, demand has been strong in the city, but there are more homes listed in the suburbs and exurbs. Prices have risen both inside and outside the city limits.
A number of factors are at play, said economist Matthew Speakman of Zillow, the online listing and research firm. Mortgage rates have been at record lows, while a generation of millennials is “aging into homeownership,” he said.
With buyers far outnumbering sellers, prices have been rising steadily, especially for new construction.
Case-Shiller calculates an index based on sales prices during three consecutive months that do not include new construction. That narrower, but deeper, view means that Case-Shiller is widely viewed as a reliable guide to the market’s direction, but it does not always reflect short-term fluctuations.
Re/Max recently reported a 15% rise in home prices for metro Atlanta. But Re/Max calculates a median price, not an average, and compares only November’s prices with those of the same month a year earlier. Re/Max also includes some newly built homes, according to a spokeswoman.
Growth in average home prices, past 12 months
1. Phoenix: 12.7%
2. Seattle: 11.7%
3. San Diego: 11.6%
4. Cleveland: 9.5%
5. Boston: 9.4%
6. Portland: 8.9%
National average: 8.4%.
13. Atlanta: 6.8%
Note: does not include prices of new homes.
Source: S&P CoreLogic Case-Shiller Indices


